

Lean is a buzzword in today’s workplace. It is especially popular in manufacturing industries. While most companies have their own version of lean, the fundamentals are the same. This article takes a look at lean manufacturing, defines it, discusses the key terms, and describes the advantages of implementing lean into the manufacturing process.
Note – there are no industry secrets in this article. The content of this article is public knowledge.
What is Lean?
Lean is a production method designed by Toyota (known as the Toyota Production System, or TPS) to reduce costs and improve profits. It does this by reducing waste, inventory, keeping headcount as low as possible, and producing only what is needed when it is needed (known as Just in Time).
This is accomplished through a set of tools that work together to reduce inventory, lead time, and make the current status and problems visual.
Some of the tools include:
- 5S
- Muda elimination (waste)
- Kanban
- Levelized production
- SMED (changeover)
- Value Stream Mapping
- Standard Work
- And many more
The tools by themselves do not make a process or organization lean. The tools are a countermeasure to waste in the production system. They have to be implemented and continuously improved. To be successful, lean concepts have to be understood and followed by all workers at every level.
Basics of Lean
The foundation of Lean is using countermeasures against waste. Of course, the primary purpose of reducing waste is to increase profit. To make more profit, many companies increase prices. The problem with this idea is there is always another company willing to do the work cheaper than you can. This has put many companies out of business.
Another way to increase profits is to use cheaper materials. This reduces quality. Lower quality will almost guarantee a loss of business.
The third method of increasing profits is to reduce costs. Quality is maintained, the price is not increased, and the company makes more profit. If enough cost can be reduced, savings can be passed on to the customer – insuring that contracts are kept and new contracts are won.
There are 8 types of waste that Lean identifies:
- Overproduction
- Waiting
- Inventory
- Conveyance
- Over-processing
- Motion
- Defects
- Manpower
Lean identifies value-added and non-value-added work and then uses the mindset of continuous improvement to reduce the non-value-added work.
5S
5S is a buzzword that is usually thought of as ‘cleanup’. I’ve heard associates claim that too much time is spent on 5S, that 5S is the least important part of the day, that it was just for customer visits, and that it was a waste of time. These same associates wanted to go home and leave a messy workstation for the next shift to deal with. These same associates complained when the previous shift left their workstations in a mess. They really did know the importance of a clean workstation.
So, what exactly is 5S? The S’s stand for Japanese words that have been transliterated into English. Here’s the list of words:
- Seiri – Sort – eliminate unneeded tools and keep tools in easily accessible areas (toolbox, etc.)
- Seiton – Straighten – arrange work, people, parts, equipment, etc., in a streamlined fashion
- Seiso – Shine – keep area, tools, and equipment clean
- Seiketsu – Standardize – ensure that all procedures are uniform
- Shitsuke – Sustain – commit to keeping it ongoing and maintained
5S promotes safety and helps to reduce waste. It reduces the extra time that is often spent looking for a tool. It keeps bad parts clearly labeled so they are not placed with good parts that reach the customer. It raises quality. It keeps dirt from getting in the parts. It raises morale – a clean home is a happy home. A cook doesn’t want to cook in a dirty kitchen. Maintaining 5S requires a commitment – a commitment by everyone in the organization from the top down.
Raising Prices vs Lowering Cost
To increase profit, companies used to raise prices as the first option (or give you less for the same price, which in essentially the same thing as raising the price). Another option was to reduce quality. I know as a consumer I hate both of these options. I don’t want to pay more for my favorite candy, but I still want it to taste the same.
Lean philosophy identifies another option: lowering the cost. Here’s a graph to demonstrate the options:
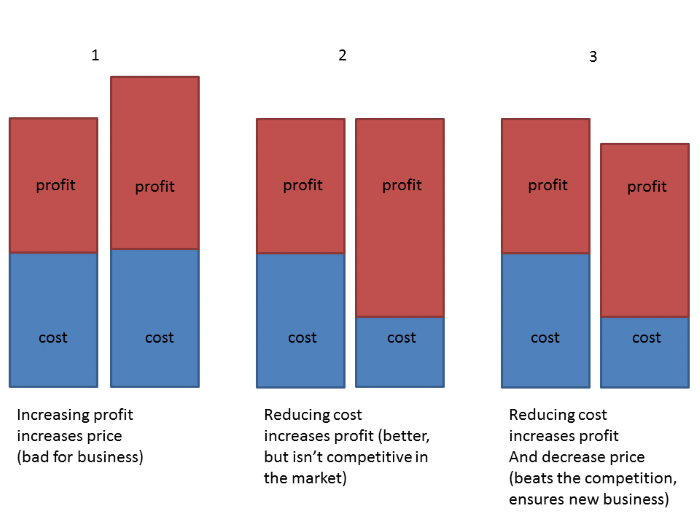
If we raise the price, the customer is upset because of having to pay more. This causes the customer to look elsewhere when it’s time to renew a contract or award new business. This kind of activity will put us out of business.
If we lower our costs, we can make a greater profit and the customer is still happy. We’ve not done anything to help the customer, but at least we can make a greater profit without the customer having to pay for it.
If we follow the third option, we can lower our costs and decrease our price. This is thinking win/win. We make more profit and the customer gets a lower price. We both win. This helps to solidify our future contracts and we stay in business longer. Lowering cost always wins over raising the price.
One key point to consider though is how we lower the cost. We don’t want to lower the cost by lowering the quality. The best way to lower the cost is to reduce waste. This includes wasted material, manpower, overhead, motion, etc. This is identifying and reducing all of the Muda (waste) within the process.
Waste
Reducing waste is pivotal in lean manufacturing. The Toyota Production System identified seven wastes (known as Muda). Many have added an eighth – under-utilized manpower. Anything that doesn’t add value to the part being built is considered waste. Here are the types of waste with explanations and examples:
Overproduction – producing the product before the customer needs it. This includes building ahead on the production line instead of holding to a one-piece flow. This keeps you from having to find a place to store the parts until the customer needs them. Also, if there is a problem in the process (for example, a machine is placing the wrong component) you have fewer parts to rework.
Waiting – this is a waste of manpower. It includes waiting on the next step in production to pull the part from the queue, waiting on parts from the previous step, and waiting on a machine to complete a process. Seconds add up to minutes which adds up to hours which costs a lot of money in the long run.
Inventory – all of the components including finished goods, work in process, and components stored on the line in the warehouse. If money is spent on inventory that the customer doesn’t need yet, then your money is tied up and can’t be used somewhere else.
Conveyance – the movement of components. This includes moving parts through the warehouse, moving parts down the production line, and moving parts to the shipping warehouse. Moving parts from one location to another does not add value to the parts. Only move as far as necessary.
Over-processing – doing work that is not necessary. This comes from the bad design of the building process and can include the use of tools, duplicating work, spending too much time making adjustments, etc. I the process doesn’t add value that the customer is paying for then delete it.
Motion – this is using more movement than should be required to perform a task. It includes reaching for something that should be closer, turning something that should already be turned in the correct orientation, walking, etc.
Defects – this is spending time repairing or reworking something. It is better to fix the root problem that is causing the issues to begin with.
Manpower – this is the use of human work. Six Sigma includes human talent. This is underutilizing the capabilities of the workforce.
In short, anything that doesn’t add value is waste and should be removed from the process. This includes every tiny motion and split second of work time.
Just In Time
Just In Time (JIT) is the practice of delivering what the customer needs, in the amount they need it when they need it. Many supporting systems have to be working in order for JIT to work properly. The time it takes for the customer to receive the product from the time they place the order is known as ‘lead time’.
To implement JIT, the lead time has to be reduced. Lead time must be tracked and reduced from the suppliers, through the warehouse, through all of the sub-processes, to the production line, into the shipping warehouse, and out to the customer.
Lead time is reduced in many ways. Reducing the amount of inventory at each step is crucial. Each location should have as little inventory as possible. Products should be produced in small lots. Many companies like to produce products in large batches, but these increases lead time and inventory. In order to keep the lots small and avoid producing in batches, the production lines must change over to different products in order to level the production. This is known as changeover or Single Minute Exchange of Die (SMED).
The information to tell each location what to build and when is controlled by Kanban. A Kanban is a ticket that explains what the part is and the amount that should be in the box. As inventory is pulled from each location, a Kanban is left behind to show what was taken. This works much like a grocery store where the shelf is restocked as products are pulled from the shelf.
Kanban and Pull Systems
A Kanban is an inventory signal. It provides information about what needs to be produced. There are several types of Kanbans used throughout the production environment. A Production Kanban is a card that tells what to produce and in what amount.
In a pull system, parts are replenished when they’re pulled by the next process. When a part is taken from the queue, that’s the signal to replenish the queue. Think of it like a shelf in a grocery store. When a can of soup is taken from the shelf that signals the stocker to replace the can of soup, which then signals the warehouse to open another box, which in turn signals to order more soup.
Sometimes an empty queue isn’t enough information. That’s where the Production Kanban comes in. The Production Kanban is an important part of the pull system. It tells the production line what was pulled, showing what should be built.
Building to a Kanban is a simple process. A Kanban is placed on the box of finished goods. When the warehouse associate takes the fished goods, the Kanban is placed back in the post. When the correct amount of Kanbans has been placed (according to lot size), this signals the material handler to bring components to build that product. The Kanban is then placed into the production sequence and inventory is replenished.
Levelizing Production
Mura is the Japanese term that means uneven. Production that is uneven is considered waste. It’s an important part of the JIT system. There’s a lot of math that goes into it, but basically, it involves changing over often enough so that inventory is kept at a minimum and lead time is reduced. This requires orders to be filled in small lots or batches.
The act of leveling production is known as Heijunka. A Lot Post is used so that inventory is controlled by Kanban. This standardizes the scheduling, which helps in material handling, warehousing, changeover, and shipping. When the correct amount of Kanbans is placed in the post, this triggers the material handler to build that product next.
Single Minute Exchange of Die (SMED) / Changeover
Single Minute Exchange of Dies, or Changeover, is one of the methods for reducing waste in the manufacturing process. It’s the process of a line changing over from one product to another in order to levelize production.
The idea is that the changeover process would take one production cycle. In other words, if the line’s cycle time is 45 seconds, then the changeover process should take 45 seconds. After all of the stations have changed over, only one cycle of production is lost.
The changeover time should be evaluated so that the least amount of time is lost. For example, if you’re changing a die inside of a machine, the process that would lose the least amount of time would be to shut down the machine only to swap the die. All of the other steps, such as going to get the die and going to return the die, can be performed while the machine is operating.
Andon
An Andon is a signal that shows the current status of a production line. Some of them can get fancy and give lots of information, but all it really needs is a green, yellow, or red indicator. This can be an electronic light or a simple flag. Simple and easy to understand is the goal. Electronic signals can give you information that can be imported into software that can track the productivity of your company. They can even be accessed through a web browser.
Modern Andon systems are tied to the production equipment and can identify which machine or station is having a problem. They can give an audio signal as well as text and graphics.
Plan Do Check Act
Known as PDCA, Plan Do Check Act is a management tool developed by Dr. Deming to control and continuously improve processes and products. PDCA follows the basic scientific method. Let’s look closer at each of the four steps.
Plan – this establishes the objective and milestones required to reach the goal.
Do – implement the plan.
Check – look at the results and compare the results to the goal.
Act – also called action and adjust, determine the root cause of the variation between the goal and the actual and take action. Basically, apply changes where needed. If no action is needed then determine where improvements can be made.
Continue the cycle until all possible improvements are made. The emphasis is on observing the current situation, then planning and implementing improvements. PDCA plays a pivotal role in lean manufacturing projects.
Standard Work
Standard work is the list of steps that each worker should perform in order and how much time each step should take to complete the process. It will include how much material should be at each location and how often the materials should be replenished. This is known as the work sequence, takt-time, and standard inventory.
The purpose of standard work is to keep a standard process flow in order to improve safety, quality, and production. It is the baseline for kaizen and continuous improvement.
The goal of standard work is to show the current method of work. It should be followed precisely, but it should also be questioned and improved often. Standard work should be considered a living document. Users should provide feedback and help make improvements.
To make changes to standard work, time studies should be used to compare before and after conditions. The information gathered is placed on forms that are used to make improvements.
Standard work includes three documents:
- Production Capacity Sheet
- Standardized Combination Table
- Standardized Work Chart
Standard work has many benefits. Work between all shifts can be documented, training becomes much easier, variability is reduced, safety and quality are improved, and a baseline is established for improvement activities.
Time Studies
Time studies are an important tool to show the current status of a production line. This information is used to discover where improvements can be made in the process. Any type of process can be timed and observed.
For work that follows short cycles and repeats, an elemental time study would be used. For abnormal work, work that follows a long cycle, or work that doesn’t repeat, a time study known as continuous observation would be used.
For example, if there is a production line with five stations, we can do a time study of each station to see how long each station takes to complete its process. This is known as the station’s cycle time. The station that has the highest cycle time is the bottleneck of the line as is the line’s cycle time. If stations 1, 2, 4, and 5 have a cycle time of 50 seconds, but station 3 has a cycle time of 65 seconds, we know that the line’s cycle time is 65 seconds and station 3 is the bottleneck (the slowest station).
By performing a time study of each station as a whole, we are doing a toggle-time or long cycle time study. This is great for showing us that station 3 is the bottleneck, but it doesn’t show us why station 3 is the bottleneck. For this information, we need to study the elements of work at station 3.
This is known as an elemental time study. For this type of time study, we have to observe the steps of work and write them on a time study sheet in order and start timing them in sequence. This type of time study will show you which elements take the most time, allowing you to focus on what needs the most improvement.
Here are some examples of the two types of time studies and the type of work they are best suited for:
Element
- Parts building
- Packing
Continuous Observation
- Warehouse worker
- Forklift driver
- Mail clerk
- Office worker
Time studies are taken with a stopwatch that has a lap function. Each element is written in a field in a time study sheet. There are plenty of free templates available online. Another option is to use a tablet with software made specifically for time studies.
Kaizen
Kaizen is a Japanese term that literally means ‘improvement’, or ‘good change’. The word kaizen in the workplace refers to continuous improvement activities in many fields including manufacturing, healthcare, management, engineering, and even personal improvement. The act of kaizen is to study the current condition to find the problem to solve, develop methods (countermeasures) that will improve the current condition, test those methods, implement the countermeasures that are successful, reflect, and start over. This is a PDCA cycle.
Kaizen activities in manufacturing usually focus on improving safety, reducing waste, reducing cost, improving output, increasing quality, reducing manpower (this doesn’t mean getting rid of people), balancing the workload, improving material handling, improving the flow of information (kanban), increasing knowledge, and more.
Kaizen activities can take anywhere from hours to months. An example of a short kaizen activity is where a group gets together to analyze a process, identify a few key problems, develop some countermeasures to try, implement those countermeasures, reflect on what was found and improved, and move on. This can take from a few hours to a few days. These are sometimes called kaizen events, blitzes, or bursts.
Longer kaizen activities often include the workers on the line. An example would be the line workers would meet for an hour every one or two weeks to discuss the project. They would select member roles (leader, presenter, etc.), analyze data for their assembly line, identify which problem to focus on, perform a deep analysis of the cause, develop countermeasures, implement countermeasures, test the results, build a presentation, and present the project to management. These kaizen projects, often called kaizen circles, usually take from three to nine months. They make great competitions.
Many tools are used during the kaizen process including Gant Charts, 5 Why Analysis, Fish Bone Diagrams, Root Cause Analysis, timelines, and many others. It is a great way to teach project management.
Kaizen plays a key role in the improvement of processes within a company. It doesn’t matter if it’s something big or small, an office or a production environment, kaizen activities are some of the most important activities any company can perform.
5 Why
A method to find the root cause of a problem is to ask ‘why’ five times. This is part of the Toyota Production System known as 5 Why. It is also known as a 5 Why Analysis. It looks at cause-and-effect relationships and helps find the cause of the problem and is great for solving quality issues.
As an example, here is a series of five whys that you might find in an automotive manufacturing company to solve a quality concern. This part was placed in a box to be sent to the customer. The next process is an offline inspection area that found that a screw was missing.
- Why did the part get placed in the box? The part passed its inspection checks.
- Why did the part pass its inspection checks? The computer saw something that looked like a screw in the correct location.
- How did the computer see a screw when it wasn’t there? There was light reflecting off the location that gave the visual brightness level that the computer was looking for.
- Why was there a light reflection at that point? The door of the machine is made of reflective metal.
- Why is the door made of reflective metal? It was what was available and can be replaced or painted.
In this case, the problem ended up being something that had the potential to never see that a screw was missing. This could be disastrous! Fortunately, it was also discovered that a different metal or simply painting the current metal would improve the computer inspection process. 5 Why won’t always give you clear answers, but asking why is a great way to point you in the right direction.
Genba
Genba, or Gemba, is a Japanese word that means ‘the real place’. It simply means ‘go to the source’. The idea is that problems will be made visible. With the problems being made visible, solutions to those problems will reveal themselves.
Management and key personnel walk the factory floor and observe the current condition of the production lines. This raises awareness and allows managers to ask questions. This is known as a Genba Walk. Genba walks are valuable to kaizen and should be performed daily for the best results.
KPI
KPI stands for Key Performance Indicator. It is a type of performance measurement that measures the success of an activity. It is important to understand which KPIs to choose. KPIs are chosen based on the needs of the organization. These needs help the organization meet its goals.
Individuals within the organization, such as Managers, Engineers, Technicians, etc., will have personal goals that match the company’s goals. When each person works to meet their goals they will help build the company into the best organization it can be.
Examples of organizational KPIs include:
- Zero customer returns
- Zero rework
- Zero waste
- 100% customer satisfaction
Of course, it might not be possible to reach zero and 100%, but with that as the target, the company can assess the current situation and make realistic targets that are then measured. The results will show the areas that are the most important to improve.
OEE
OEE stands for Overall Equipment Effectiveness. It was developed in the 60s to evaluate the effectiveness of a manufacturing process. OEE is not an absolute measure. It is used to indicate the process performance to be improved and to show how to get the improvement.
The measurement is a KPI and should be used based on the process and goal of improvement. For example, if the equipment sits idle for 80% of the available time, it is not being utilized to its fullest extent.
There are six metrics for OEE:
- Top Level
- How well the unit performs relative to its capacity
- How often it operates compared to the time available
- Underlying
- Loading
- Availability
- Performance
- Quality
Availability, performance, and quality are the three primary measurements. These are used to calculate the OEE percentage that you can track.
The formula is (Availability)*(Performance)*(Quality)
An example would be:
(Availability = 85%)*(Performance = 91%)*(Quality = 94.2%)
OEE = 72.8%
There are many other methods to use and calculate OEE including time, performance, and loss.
Value Stream Mapping
Value Stream Mapping is a standardized charting method that shows how material and information flow through the process from the supplier to the customer. The Toyota Production System refers to this as a Material Information Flow Diagram (MIFD). It typically shows material flowing from left to right (from supplier to customer) as information flows from right to left (from customer to supplier).
A value stream map is used to show the current condition of a production system in contrast with another to show the ideal condition. The two maps are then analyzed and the gaps are identified. They are then prioritized and work begins in attaining the ideal situation.
A typical map will show from left to right: the supplier, incoming warehouse, sub-processes, assembly process, staging warehouse, and the customer. The map will show the amount of inventory at each location and the lead time for a product to go from the supplier to the customer. From right to left is the information flowing backward through those same processes and the type of information, such as a Kanban and Kanban post. This shows opportunities for reducing inventory and improving communication, which in turn reduces cost and increases productivity.
Value Stream Maps can be drawn by hand or with software such as PowerPoint, Excel, AutoCAD, Visio, or specialized programs.
Conclusion
This is a greatly simplified explanation of the elements of lean manufacturing. The idea behind lean is that processes are always being improved to reduce waste. It’s the process and philosophy of continuous improvement. If you’re not continuously improving, then you’re losing money, and potentially losing quality and customers.
Resources for Further Study
Lean is a large topic and this overview just scratches the surface. Here is a list of books and websites for more information about lean manufacturing.
Books
The Toyota Way: 14 Management Principles from the World’s Greatest Manufacturer
How To Implement Lean Manufacturing, Second Edition
Websites and Articles
Wikipedia – Lean manufacturing


0 Comments